Key points
- The offset between a visual stimulus and its marker in the EEG comes from four links: the stimulation software, the screen, marker transmission and the amplifier.
- A constant delay can be corrected. Variability from one trial to the next cannot: it smears and weakens the average.
- The only way to know the actual timing is to measure it with a photodiode, on your screen, with your program.
- The amplifier itself adds a known delay: 36 ms at 1,000 samples per second for a Net Amps 400, to be compensated during segmentation.
Why a few milliseconds matter
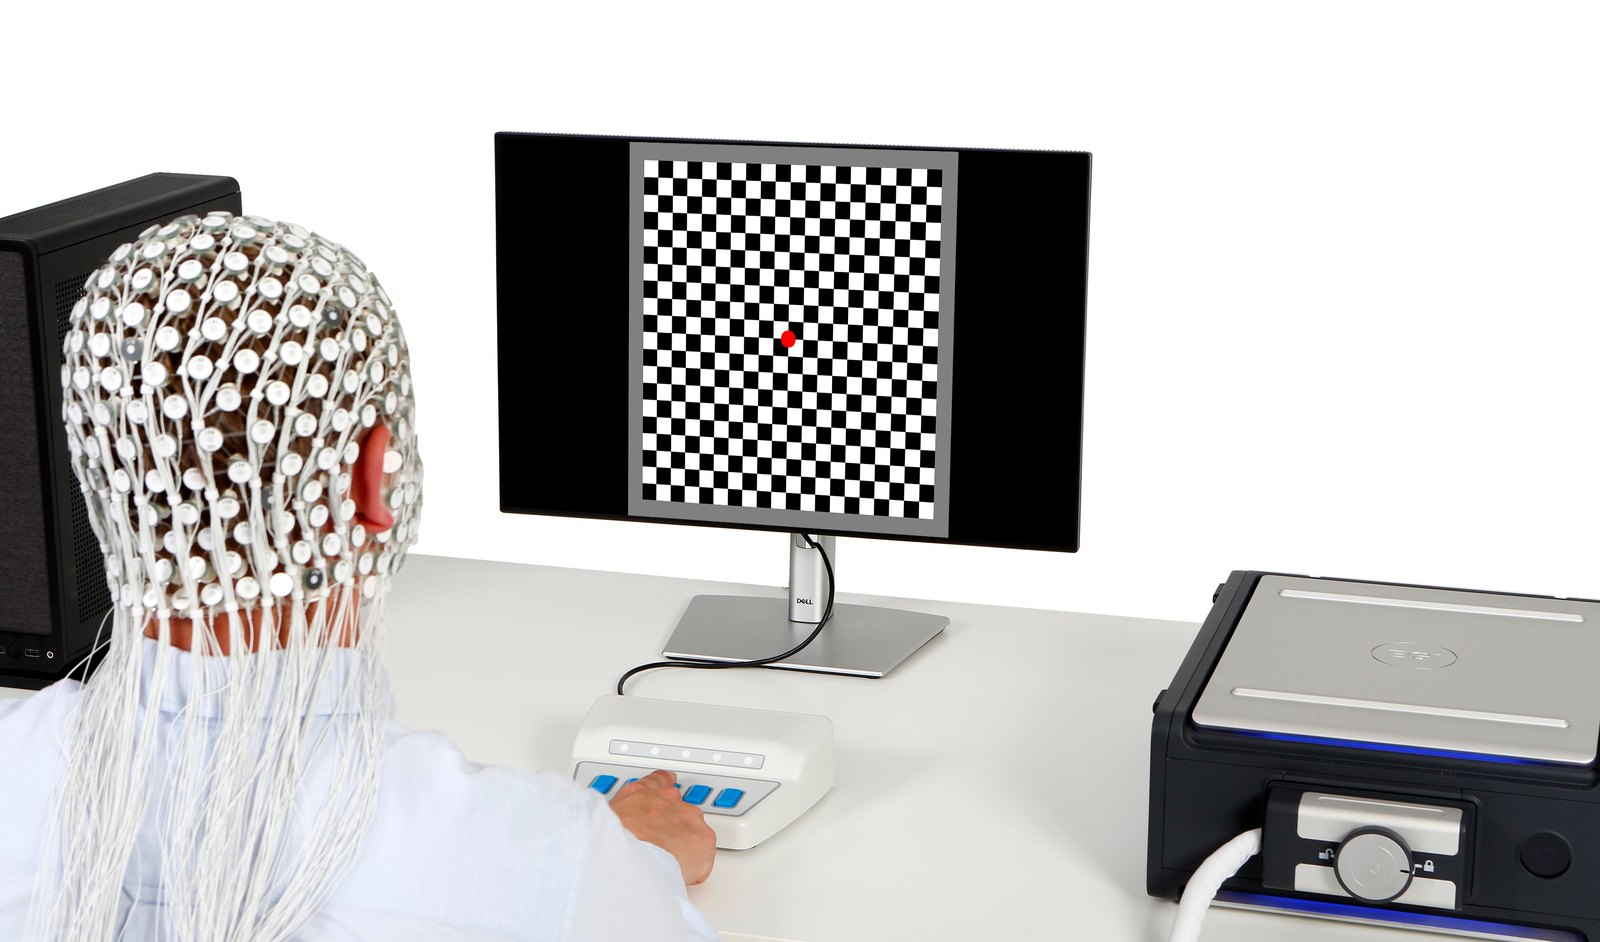
An evoked potential is obtained by averaging tens or hundreds of trials aligned on the stimulus. Two alignment faults have different effects.
- If every trial is shifted by the same duration, measured latencies are wrong by that duration. A component expected at 100 ms appears at 130 ms.
- If the offset varies from trial to trial, the average is smeared: brief components lose amplitude and sharpness.
Time-frequency analyses, oscillation phase and closed-loop protocols are even more sensitive to these faults.
The four links in the chain
From software to signal: where the offset arises
- 1Stimulation softwareUnder one millisecond on average with specialised software.
- 2ScreenWaiting for the refresh, input lag, top-to-bottom scan.
- 3MarkerTTL pulse, or network message with synchronised clocks.
- 4AmplifierAnti-aliasing filter delay: 36 to 112 ms depending on the sampling rate.
1. The stimulation software
Specialised software does its job well. A 2020 study (Bridges et al.), on more than 110,000 trials measured with a dedicated device, found mean precision under one millisecond for Psychtoolbox, PsychoPy, Presentation and E-Prime. Precision was generally slightly better on Linux than on Windows, and poorer on macOS for visual stimuli. Experiments run in a browser were more variable.
An earlier study (Garaizar and Vadillo, 2014) concluded that PsychoPy presents brief visual stimuli with high accuracy, with errors appearing only in very demanding tests.
2. The screen
A screen does not display an image at just any moment: it draws it at each refresh. At 60 Hz, a frame lasts 16.7 ms; at 120 Hz, 8.3 ms. Three consequences:
- a stimulus can only appear at the refresh following the request, and its duration is a whole number of frames;
- the screen processes the signal before displaying it: this input lag is specific to each model and each setting;
- the image is built from top to bottom: a stimulus at the bottom of the screen appears a few milliseconds after a stimulus at the top.
3. Marker transmission
The marker reaches the EEG in two ways. A TTL pulse on a digital input of the amplifier is written at the moment it arrives. A message sent over the network carries a time: the clocks of the stimulation computer and the EEG system then have to be synchronised, and their drift corrected during the recording.
4. The amplifier
The amplifier's anti-aliasing filter delays the EEG signal relative to real-time events. The Net Amps 400 manual gives this delay for each sampling rate.
| Sampling rate | EEG delay |
|---|---|
| 1,000 samples per second | 36 ms |
| 500 samples per second | 66 ms |
| 250 samples per second | 112 ms |
This delay applies to events received in real time, by digital input or over the network. It is compensated in the Net Station segmentation tool, by adding the corresponding value to the offset.
Constant delay or variability: the distinction that matters
| Constant delay | Variability | |
|---|---|---|
| Examples | Amplifier filter, screen input lag | Marker sent without waiting for the refresh, processor load, unsynchronised clocks |
| Effect | Shifted latencies | Smeared averages, reduced amplitudes |
| Remedy | Measure, then subtract | Remove the cause; failing that, realign each trial on the photodiode |
A well-tuned set-up has a constant, known and documented delay, and variability of the order of one millisecond.
Measuring actual timing
No data sheet replaces a measurement on your own set-up. The method takes five steps.
- Display a marker square in a corner of the screen that switches from black to white on the same frame as the stimulus.
- Attach a photodiode to that square and connect it to an amplifier input.
- Run your real program, with your stimuli, over several hundred trials.
- Compare, for each trial, the time of the software marker and the photodiode edge.
- Record the mean and the standard deviation. The mean is the offset to correct; the standard deviation tells you whether your set-up is healthy.
The authors of the 2020 study say so themselves: each team must validate the timing of its own stimuli, on its own configuration.
Ten good practices
- Synchronise the display with the screen's vertical refresh.
- Send the marker at the moment the image changes, not before the stimulus is computed.
- Express durations as a number of frames, not arbitrary milliseconds.
- Use the screen at its native resolution and refresh rate, without scaling.
- Avoid screen mirroring between the participant's monitor and the experimenter's.
- Keep the marker square and the photodiode throughout the study, not only during tests.
- Close other programs and turn off automatic updates during acquisition.
- Record the versions of the system, the graphics driver and the stimulation software.
- Repeat the measurement after every hardware or software change.
- State the measured offset and the correction applied in your publications.
With an EGI system
- PsychoPy: the open-source egi-pynetstation library connects a PsychoPy experiment to Net Station. It starts and stops the recording, sends timestamped markers and corrects clock offset and drift.
- E-Prime: the E-Prime Extensions for Net Station synchronise clocks over the network and transmit the stimuli, responses and information for each trial.
- Digital inputs: the amplifier receives TTL pulses for hardware markers and the photodiode.
- Checking: an optional audio-video adapter makes it possible to verify the precision of markers recorded with the EEG.
- Correction: the filter delay and the measured offset are compensated in the Net Station segmentation tool.
- GES 500: synchronisation by network time protocol and bidirectional TTL.
We carry out this validation with you at installation, on your screen and your program.
Frequently asked questions
What delay does the EEG amplifier introduce?
It depends on the amplifier and the sampling rate. For EGI's Net Amps 400, the manual gives an anti-aliasing filter delay of 36 ms at 1,000 samples per second, 66 ms at 500 and 112 ms at 250. This delay is constant: it is corrected at segmentation.
How precise is stimulation software?
A 2020 study of more than 110,000 trials measured mean precision under one millisecond for Psychtoolbox, PsychoPy, Presentation and E-Prime, for visual and auditory stimuli and response times. The authors stress the need to measure timing on your own configuration.
How do you measure the offset between the stimulus and the marker?
With a photodiode attached to the screen, over a square that changes luminance at the same time as the stimulus. Its signal is recorded with the EEG. The difference between the software marker and the photodiode edge, measured over several hundred trials, gives the mean offset and its variability.
Does the measurement need to be repeated?
Yes, after any change: screen, graphics card, driver, system or stimulation software update, sampling rate. And at the start of each study.
Sources
The scientific publications come from PubMed.
- Bridges D, Pitiot A, MacAskill MR, Peirce JW. The timing mega-study: comparing a range of experiment generators, both lab-based and online. PeerJ. 2020;8:e9414. doi:10.7717/peerj.9414
- Garaizar P, Vadillo MA. Accuracy and precision of visual stimulus timing in PsychoPy: no timing errors in standard usage. PLoS One. 2014;9(11):e112033. doi:10.1371/journal.pone.0112033
- Magstim EGI. GES 400 Research System Hardware Manual, section “Anti-aliasing Filter Effects on EEG Timing”.
- egi-pynetstation, documentation. egi-pynetstation.readthedocs.io
- Psychology Software Tools. E-Prime Extensions for Net Station, brochure. PDF
This article is general information for research teams. It is based on the manufacturers' documents and the abstracts of the publications cited. Gaze Intelligence distributes Magstim EGI systems: this article is written by a distributor.